Lincoln, Neb. —Welcome to the Research Roundup: a collection of highlights from the latest Husker research and creative activity.
Getting wind of insecticide spread
For the sake of protecting crops against the numerous insects that beat people to the plate by eating those crops in the field, many companies now coat their seeds with insecticides. One popular class of insecticide, neonicotinoids, has proven effective against a variety of potential pests that feast on roots, stems and leaves alike. But that very strength sometimes manifests as a weakness: Neonicotinoids can also harm both the pests’ natural predators and the bees, butterflies and other pollinators critical to agriculture worldwide.
That unintended consequence usually arises when the pesticide particles of treated seeds scrape off during the planting process. Water and wind can then carry those free particles to other plants, where pollinators and other beneficial insects consume the insecticides via nectar or pollen. Still, little research has tried to quantify how much of the seed-treated insecticides are spreading through the air — or refine new tools to better measure that spread.
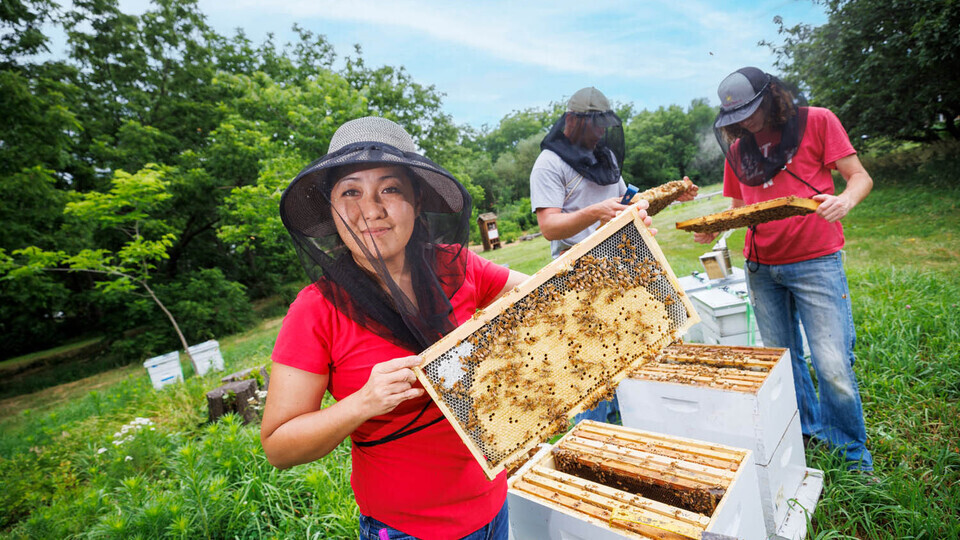
The Department of Entomology’s Judy Wu-Smart and Surabhi Gupta Vakil recently teamed with the Nebraska Water Center’s Daniel Snow to do just that. As part of a three-year study at the Eastern Nebraska Research and Extension Center near Mead, Nebraska, the team planted 17 wildflower-covered, pollinator-friendly plots next to corn and soybean fields. Over that time, the researchers also constructed and placed 51 sticky traps: adhesive-coated microscope slides that they mounted on posts roughly 5 feet tall.
The team quantified insecticide concentrations by dividing the insecticide residue on each sticky trap by the surface area of the trap itself. A lab-based analytical technique then allowed the team to identify 12 specific seed-treated compounds captured by the traps. Two particular neonicotinoids — clothianidin and thiamethoxam — were found in 98% and 80% of the samples, respectively.
That combination of simple, low-cost sampling method and sensitive, well-established analysis could help researchers learn more about the fates and potential consequences of airborne, off-target insecticides, the team said.
Question and answer
The designers of surveys try to anticipate and account for all sorts of issues. High on that list is readability: Roughly 40% of survey organizations rely on some tool or another to test whether a questionnaire is written simply enough that it can be read and understood by anyone who receives it. But survey designers often use other, computer-aided measures, too — especially the Question Understanding Aid (QUAID) and the Survey Quality Predictor (SQP) — to evaluate their questionnaires.
Together with Husker alumna Rachel Stenger, the Department of Sociology’s Kristen Olson and Jolene Smyth wondered about the amount of overlap among the many readability and other evaluation tools available to survey designers. If that overlap were substantial, designers might be better off relying on, say, one readability measure and disregarding the rest for the sake of maximizing their time and money. But if those tools instead complemented each other — measuring different facets of readability and questionnaire quality — designers might be underserved or misled by resorting to just one.
To get at that question, the researchers turned to the Community Values and Opinions in Nebraska Survey, a questionnaire conducted by the university’s Bureau of Sociological Research. With that survey as its source of questions, the team compared the results of six different readability measures not only against each other, but against the QUAID and SQP tools.
The trio found that the readability tools tended to reach different conclusions about the survey’s questions. Whereas one proposed that 58% of the questions met a certain readability threshold, for instance, another concluded that just 17% of those same questions did. As a whole, the results of those readability tools often failed to overlap with the QUAID or SQP, either, suggesting that the three were generally identifying distinct survey problems.
Stenger, Olson and Smyth ultimately recommended that survey designers use at least two readability tools, with the researchers even specifying the subsets from which those tools should be drawn.